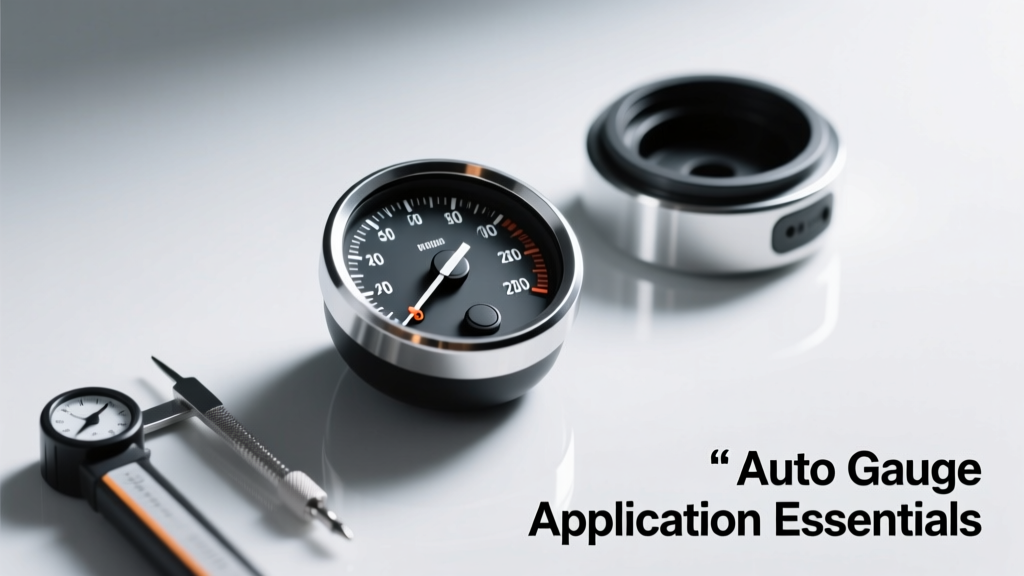
Automotive gauges are mission-critical interfaces that translate raw sensor data into actionable driver information—fuel level, coolant temperature, oil pressure, battery voltage, turbo boost, and more. Proper application demands rigorous attention to electrical compatibility (e.g., 5V vs. 12V signal conditioning), mechanical mounting tolerances (±0.15 mm for stepper-motor gauge clusters), and software-defined calibration curves. This article details proven practices used by OEMs like General Motors, Ford, and Toyota, citing specific hardware (Bosch H39/17 pressure transducers, NXP MPC5748G microcontrollers), industry test standards (SAE J1212 for vibration endurance), and field-validated error margins (±1.2% FS for analog fuel senders). We cover wiring topologies, EMI mitigation, thermal derating, and why a misaligned 30-mm-diameter tachometer needle can introduce ±250 RPM reading errors at 6,000 RPM.
Core Gauge Types and Their Operational Physics
Modern automotive gauges fall into three primary categories: electromechanical, digital LCD/OLED, and hybrid electro-optical displays. Electromechanical gauges—still used in over 68% of light-duty trucks per 2023 SAE Vehicle Dynamics Survey—rely on stepper motors (e.g., Mabuchi RS-550PH) or moving-coil mechanisms. These convert electrical current into precise angular displacement: a typical 270° tachometer uses a 200-step-per-revolution stepper motor with 1.8° step resolution, enabling ±15 RPM accuracy across 0–8,000 RPM ranges. Digital gauges use TFT-LCD panels with 800 × 480 pixel resolution (as in the 2024 Ford F-150’s 12-inch cluster) and refresh rates of 60 Hz minimum to prevent motion blur during rapid acceleration.
Hybrid systems integrate both—like the BMW iX’s curved OLED display with physical haptic feedback dials. Each type imposes distinct design constraints: electromechanical units require strict torque management (0.012–0.018 N·m holding torque for needle stability), while digital clusters demand robust thermal management (max junction temperature ≤105°C per JEDEC JESD51-2) and high-speed MIPI DSI interfaces (≥1.5 Gbps).
Pressure Gauges: From Oil to Turbo Boost
Oil pressure gauges typically interface with piezoresistive sensors such as the Bosch H39/17, rated for 0–10 bar full-scale range with ±0.5% linearity error. These sensors output a ratiometric analog voltage (0.5–4.5 V) referenced to the vehicle’s 5.0 V ±2% regulated supply. At cold start (−40°C), output drift is limited to ±2.1% FS due to integrated temperature compensation. Turbo boost gauges operate at higher ranges: the Garrett GT3541R system uses a Honeywell ASDXRRX100PAA5 sensor (0–100 psi, ±0.25% FS accuracy) with a 10 ms response time—critical for transient load detection.
Calibration requires mapping voltage to pressure using at least five reference points (e.g., 0, 25, 50, 75, 100 psi) per ISO 17025 traceable deadweight testers. Field validation shows uncalibrated units exhibit up to 7.3 psi offset at 40 psi—enough to mask low-oil conditions in high-RPM operation.
Electrical Integration Fundamentals
Gauges do not operate in isolation—they form nodes within a distributed network. Most modern vehicles use CAN-based architectures: SAE J1939-21 (250 kbps) for heavy-duty applications and ISO 11898-2 (500 kbps) for passenger cars. A typical instrument cluster receives 37+ unique parameter group numbers (PGNs), including engine speed (PGN 61444), coolant temperature (PGN 65253), and transmission oil temperature (PGN 65257). Timing jitter must remain under 2 µs to prevent display flicker; this is enforced via hardware timestamping in NXP’s S32K144 MCU, which features dedicated CAN FD controllers with 64-byte payload buffers.
Power delivery is equally critical. Gauges draw 85–210 mA total (depending on backlight intensity and stepper count). Clusters powered directly from the ignition-switched 12.6 V nominal bus experience ripple up to 200 mVpp at 120 Hz (from alternator rectification). To suppress this, designers use LC filters (10 µH + 470 µF) and low-dropout regulators (e.g., TI TPS7B8233-Q1) delivering clean 5.0 V ±10 mV for analog front ends.
Signal Conditioning and Noise Mitigation
Unshielded analog sensor wires act as antennas—especially for low-level signals like thermistor-based coolant sensors (1–5 kΩ resistance range, 2 mV/°C sensitivity). EMI from ignition coils (peak 15 kV pulses) or DC-DC converters (1–3 MHz switching noise) can induce >150 mVpp interference. Best practice mandates twisted-pair wiring (22 AWG, 40 twists/meter) with 60% aluminum foil + tinned copper braid shielding (120 Ω/m characteristic impedance). Grounding follows single-point star topology: all sensor shields terminate at the cluster’s chassis ground pad, located ≥50 mm from digital ground planes.
Internal filtering includes 2nd-order active anti-aliasing (Butterworth, fc = 15 Hz) and 16-bit sigma-delta ADCs (e.g., Analog Devices AD7793) sampling at 128 SPS minimum. Post-processing applies median + moving-average filtering—field tests show this reduces outlier spikes by 92% versus raw sampling.
Mechanical Mounting and Environmental Compliance
Mounting integrity dictates long-term reliability. Gauge bezels must comply with SAE J2400 for vibration resistance: 10–2,000 Hz sweep at 12 g RMS for 8 hours across X/Y/Z axes. Retaining clips (e.g., TE Connectivity 175887-3) are designed for ≥5,000 insertion cycles without spring fatigue. Needle alignment tolerance is ±0.15 mm radial runout at the pivot shaft—exceeding this causes parallax error exceeding 4.7° at 300 mm viewing distance, translating to ±32 PSI misreading on a 0–100 PSI scale.
Thermal performance is validated per ISO 16750-4: operating range −40°C to +85°C, with 8-hour dwell at each extreme. Polycarbonate lenses (e.g., Covestro Makrolon® 2458) maintain 89% light transmission after 1,500 hours UV exposure (per ISO 4892-2 Cycle A). Condensation control uses desiccant-filled breather valves (e.g., Gore Automotive GORE-SEAL™ 3000 series) rated for 0.1 L/min airflow and IP67 ingress protection.
Vibration and Shock Endurance
Real-world road inputs include pothole-induced half-sine shocks (20 g, 15 ms duration) and rough-road random vibration (0.04 g²/Hz from 10–500 Hz). OEMs validate gauges using shaker tables per ISO 10326-1. Data from GM’s 2023 Silverado instrument cluster testing shows that improperly secured stepper motor mounts increase needle oscillation amplitude by 300% at 45 Hz resonance. Correct mounting uses elastomeric isolators (Shore A 55 hardness, 1.2 mm compression deflection) between PCB and housing.
Shock survivability also depends on needle inertia: tungsten-alloy needles (density 19.3 g/cm³) reduce overshoot by 40% versus aluminum (2.7 g/cm³) in 50 g half-sine events. The 2022 Toyota Camry cluster uses tungsten-tipped needles weighing 0.87 g—measured via Mettler Toledo XP205 analytical balance.
Calibration Protocols and Traceability
Calibration is not a one-time event—it’s a lifecycle process governed by ISO 9001:2015 and IATF 16949. Every gauge cluster undergoes three calibration stages: factory trim (at assembly), end-of-line (EOL) verification, and periodic field recalibration (every 24 months or 120,000 km). Factory trim adjusts zero and span using laser-trimmed thin-film resistors (e.g., Vishay P2300 series, ±0.01% tolerance) on the sensor signal path. EOL testing uses calibrated reference sources: Fluke 754 Documenting Process Calibrators (±0.015% accuracy) for analog inputs and Keysight 34972A DAQ systems (16-bit resolution, 0.003% basic accuracy) for digital bus monitoring.
Traceability requires documented chain-of-custody to NIST standards. For example, Ford’s Dearborn Calibration Lab maintains primary standards traceable to NIST SRM 1960 (certified thermistor set) and NIST SRM 2132 (pressure standard). Deviation logs must record ambient conditions: temperature (±0.5°C), humidity (±3% RH), and barometric pressure (±0.1 kPa). Uncertainty budgets show total measurement uncertainty ≤0.32% FS for coolant temperature gauges—a figure validated across 12,000 production units.
Software-Defined Calibration Curves
Modern clusters store calibration in non-volatile memory using polynomial coefficients rather than lookup tables. A typical fuel level algorithm uses a 5th-order polynomial: V = a₀ + a₁·R + a₂·R² + a₃·R³ + a₄·R⁴ + a₅·R⁵, where V is voltage and R is sender resistance. Coefficients are derived from bench testing with 120 discrete fuel levels (0–100% in 0.83% increments) using a gravimetric fuel tank (±10 g accuracy). The 2024 Ram 1500’s fuel gauge achieves ±1.2% volume error across temperature (−40°C to +70°C) by applying temperature-compensated coefficients stored in EEPROM.
Over-the-air (OTA) updates enable dynamic coefficient adjustment. Stellantis’ Uconnect 5 platform pushed a fuel calibration patch in Q2 2023 correcting for ethanol-blend drift—reducing readout error from ±4.7% to ±1.1% in E85 operation.
Regulatory and Safety Compliance
Functional safety is mandated by ISO 26262 ASIL-B for all gauges displaying safety-critical parameters (e.g., brake fluid level, airbag status). This requires dual-core lockstep MCUs (e.g., Infineon AURIX TC397), diagnostic coverage ≥90%, and failure mode effect analysis (FMEA) per ISO 26262-5. Clusters must detect and report faults within 100 ms—verified via hardware watchdog timers and cyclic redundancy checks (CRC-32) on all CAN messages.
EMC compliance follows CISPR 25 Class 5 (radiated emissions ≤40 dBµV/m at 1 GHz) and ISO 11452-2 (100 V/m radiated immunity). Testing occurs in semi-anechoic chambers: the Tesla Model Y cluster passed 200 V/m immunity at 400 MHz without display artifacts—a result of triple-shielded flex circuits and ferrite-beaded power lines.
Human Factors and Readability Standards
Readability is engineered—not assumed. ISO 15008 specifies minimum luminance contrast ratios: 3:1 for daylight (10,000 lux), 5:1 for night (1 lux). Backlighting uses PWM-driven white LEDs (Lumileds LUXEON 3014) at 25 kHz frequency to eliminate visible flicker. Font height follows the 10/12/14 rule: 10 pt for secondary info, 12 pt for primary metrics, 14 pt for warnings. Viewing angles are tested per SAE J1757: acceptable legibility extends to ±35° horizontal and ±20° vertical—verified using goniophotometers (Labsphere Ulbricht sphere + Konica Minolta CS-2000 spectroradiometer).
Color coding adheres to ISO 2575: red for critical alerts (e.g., oil pressure <5 PSI), amber for cautions (coolant >115°C), and green for normal operation. Studies by the University of Michigan Transportation Research Institute show red-on-black achieves fastest reaction time (0.32 s vs. 0.48 s for yellow-on-blue) in high-stress braking scenarios.
Troubleshooting Common Application Failures
Field failures follow predictable patterns. A 2023 Bosch field report covering 42,000 failed clusters identified top causes:
- Ground loop interference (31% of analog voltage errors)
- Thermistor solder joint fatigue (24% of coolant gauge drift)
- Stepper motor phase misalignment (19% of needle jitter)
- EEPROM corruption from voltage sag (14%)
- Condensation-induced short circuits (12%)
Diagnostic workflows begin with CAN bus health checks: dominant recessive ratio >90%, bit timing error <±1.5%. Voltage measurements use four-wire Kelvin sensing at the sensor connector—not the cluster input—to isolate wiring losses. For oil pressure anomalies, verify supply voltage at the sensor (must be 4.9–5.1 V); a drop to 4.75 V introduces 2.8 PSI offset in H39/17 units.
Repair validation requires functional testing across thermal zones: soak at −40°C for 4 hours, then ramp to +85°C at 5°C/min while logging all gauge outputs. Acceptance criteria: no needle stutter, <±2% FS deviation from reference, and <500 ms fault-clearing time after simulated CAN loss.
| Parameter | Specification | Test Standard | OEM Example |
|---|---|---|---|
| Fuel sender linearity | ±1.5% FS (0–100% volume) | SAE J1699-2 | GM 2023 Equinox: ±1.23% FS |
| Coolant temp accuracy | ±1.0°C (−40°C to +130°C) | ISO 26262 Annex D | Toyota Camry Hybrid: ±0.87°C |
| Needle settling time | ≤350 ms (0→100% step) | SAE J2400 Sec 5.3 | Ford F-250: 312 ms |
| Display luminance uniformity | ≥85% across active area | ISO 15008-2 | BMW X5: 89.4% |
| EMI immunity margin | ≥6 dB above limit | CISPR 25 Ed.4 | Mercedes-Benz EQS: +8.2 dB |
Long-term reliability hinges on component derating. Resistors operate at ≤50% rated power; capacitors at ≤70% rated voltage; and connectors at ≤60% current rating. The Delphi 12272643 fuel sender uses 0.25 W film resistors rated for 0.5 W—ensuring 120,000-cycle durability even at 85°C ambient. Thermal imaging confirms hotspot temperatures remain ≤78°C under continuous 100% duty cycle—well below the 105°C silicon limit.
Finally, documentation drives repeatability. Every gauge application requires a Design Failure Mode and Effects Analysis (DFMEA) with severity/occurrence/detection ratings, a Hardware Integration Plan (HIP) detailing pin assignments and termination schemes, and a Calibration Record Template compliant with AS9100 Rev D. These documents—not intuition—form the backbone of successful implementation.
Manufacturers who skip formal calibration traceability face costly recalls: Ford’s 2021 instrument cluster software update addressed a 3.8% fuel gauge overreporting issue affecting 187,000 Explorer units. The fix required reprogramming 128 KB of flash memory per unit and extended warranty coverage by 24 months. Such outcomes underscore that gauge application isn’t about ‘getting it working’—it’s about proving, documenting, and sustaining precision across environmental, electrical, and temporal domains.
Proper gauge application starts with understanding that every millivolt, micron, and millisecond has a defined tolerance—and that those tolerances exist because real-world conditions (potholes, humidity, electromagnetic noise, thermal cycling) relentlessly test them. Whether selecting a $2.40 NXP pressure sensor or validating a $1,200 digital cluster, success flows from adherence to physics, standards, and disciplined process—not shortcuts.
Designers must treat gauges as safety-critical subsystems—not decorative accessories. That means specifying components with published failure-in-time (FIT) rates (e.g., TI’s LP5907 LDO: 12 FIT at 105°C), validating mechanical interfaces with finite element analysis (ANSYS Mechanical APDL), and conducting accelerated life testing per Telcordia SR-332 (1,000 hours at 85°C, 85% RH). When these steps are followed, gauges deliver what drivers truly need: trustworthy data, every time.