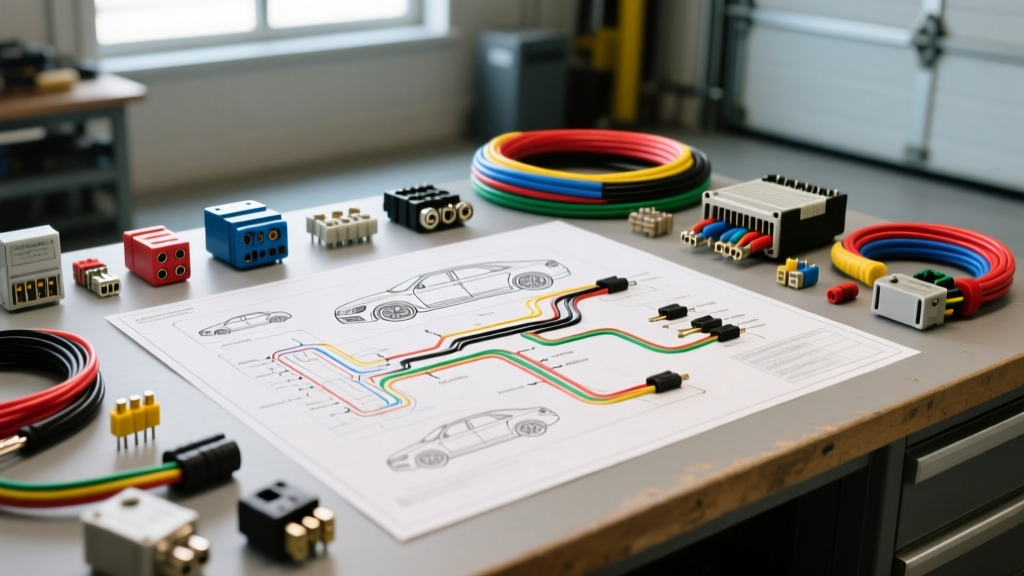
Decoding Free Auto Electrical Wiring Diagrams for Advanced Diagnostics
When technicians and advanced DIYers search for free auto electrical wiring diagrams, they are often met with generic schematics that lack the critical detail required for modern multiplexed vehicle networks. While OEM service portals require expensive subscriptions, leveraging high-quality free auto electrical wiring diagrams from enthusiast archives, factory manual leaks, or open-source automotive databases requires a disciplined, step-by-step troubleshooting flow. Without a structured approach, misinterpreting a ground node or misidentifying a CAN bus topology can lead to hours of wasted diagnostic time and unnecessary module replacement.
This guide outlines a professional-grade diagnostic flow for tracking parasitic battery draws and module wake-up faults using standard schematic conventions, bridging the gap between free documentation and dealer-level diagnostic strategies.
Phase 1: Schematic Verification and Topology Mapping
Before connecting a Digital Multimeter (DMM) or an oscilloscope, you must validate the schematic's origin and decode its specific legend. Free diagrams often mix ISO, DIN, and SAE standards depending on the vehicle's origin and the year of publication.
Wire Color and Gauge Standards
European vehicles typically utilize DIN 72551 color codes and metric cross-sections (mm²), while American and Asian vehicles rely on SAE J1128 color codes and American Wire Gauge (AWG). Misreading a 0.8mm² wire as 18 AWG instead of 20 AWG can skew your voltage drop calculations. According to the SAE J1128 standard for low-tension primary cable, understanding the exact copper stranding and insulation thickness is vital for calculating resistance over long harness runs.
| Color Code (DIN 72551) | Color Code (SAE J1128) | Metric (mm²) | AWG Equivalent | Typical Application |
|---|---|---|---|---|
| sw (Schwarz) | BLK (Black) | 2.5 mm² | 14 AWG | Ignition Feed / Power Windows |
| rt (Rot) | RED (Red) | 4.0 mm² | 12 AWG | Main Battery Feed / Starter |
| gn (Grün) | GRN (Green) | 0.5 mm² | 20 AWG | CAN-H / Sensor Signals |
| ge (Gelb) | YEL (Yellow) | 0.35 mm² | 22 AWG | LIN Bus / Airbag Clockspring |
Identifying Ground Nodes and Splice Packs
Free wiring diagrams usually designate ground nodes with a 'G' prefix (e.g., G101, G204) and splice packs with an 'S' prefix (e.g., S104). A common failure mode in late-model vehicles involves corrosion at a shared ground node. If G104 serves both the Body Control Module (BCM) and the HVAC actuator, a poor ground at the HVAC motor can backfeed voltage into the BCM's ground circuit, preventing the BCM from entering 'sleep' mode. Always map the physical location of these nodes using the diagram's component locator grid before testing.
Phase 2: The Non-Intrusive Parasitic Draw Troubleshooting Flow
The most critical error when using free auto electrical wiring diagrams to diagnose a dead battery is breaking the circuit to insert an ammeter in series. Modern vehicles with complex CAN/LIN networks will wake up modules the moment power is restored, masking the true parasitic draw. Instead, use the wiring diagram to perform a non-intrusive voltage drop test across the fuses in the Power Distribution Center (PDC) or Battery Junction Box (BJB).
Step-by-Step Voltage Drop Flow
- Prepare the Vehicle: Close all doors, latch the hood (to simulate a closed state for the under-hood fuse box), and remove the key. Wait for the vehicle's sleep timer (typically 15 to 45 minutes).
- Identify Fuse Ratings: Use your free wiring diagram to identify the amperage rating and physical size (ATO, Mini, LP-Mini, J-Case) of every fuse in the BJB.
- Measure Millivolts (mV): Set your DMM to the DC millivolt scale. Place the probes on the exposed test points on the top of each fuse. Do not pierce the wires; use the fuse test points.
- Calculate the Draw: A standard 10A ATO fuse will drop approximately 1.2mV per 100mA of current. If you read 6.0mV across a 10A fuse, the circuit is drawing roughly 500mA.
| Fuse Type & Rating | 100mA Draw (mV) | 250mA Draw (mV) | 500mA Draw (mV) |
|---|---|---|---|
| Mini / 10A | 1.5 mV | 3.8 mV | 7.5 mV |
| ATO / 15A | 0.9 mV | 2.2 mV | 4.5 mV |
| ATO / 20A | 0.6 mV | 1.5 mV | 3.0 mV |
| J-Case / 40A | 0.4 mV | 1.0 mV | 2.0 mV |
Note: Always consult the specific fuse manufacturer's datasheet, as metallurgy variations can alter these baseline resistance values. For deeper insights into non-intrusive testing, refer to Fluke's automotive testing guidelines on parasitic draws.
Phase 3: Tracing the Module Wake-Up Signal
Once you have isolated the offending circuit using the voltage drop method, consult your free wiring diagram to see what modules are connected to that specific fuse. If the fuse powers a gateway module or a telematics unit, the issue is likely a network wake-up fault rather than a hard short to ground.
CAN Bus and LIN Bus Diagnostics
Modern vehicles use multiplexed networks to allow modules to communicate and wake each other up. If a door latch microswitch fails internally, it may send a continuous 'door open' signal over the LIN (Local Interconnect Network) bus, forcing the BCM to stay awake.
- CAN-H / CAN-L Verification: With the DMM set to DC Volts, backprobe the OBD-II DLC (Data Link Connector). Pin 6 is CAN-H (should read 2.5V to 3.5V) and Pin 14 is CAN-L (should read 1.5V to 2.5V). If both read 2.5V exactly, the network is asleep or terminated incorrectly.
- Termination Resistance: Disconnect the battery and measure resistance between CAN-H and CAN-L at the DLC. You should read exactly 60 ohms. This indicates the two 120-ohm terminating resistors (usually located in the BCM and the PCM) are intact. A reading of 120 ohms means one module is missing or a wire is broken; a reading near 0 ohms indicates a short between the CAN lines.
- Connector Cavity Pinout: When using free diagrams to backprobe a module, pay close attention to connector cavity numbering. A 32-way Delphi Packard connector does not number sequentially in a straight line. It typically uses a matrix (e.g., A1-A8, B1-B8). Misidentifying Pin 14 as Pin 41 will result in probing a high-current injector driver instead of a low-voltage CAN signal, potentially destroying your DMM or oscilloscope.
Phase 4: Isolating the Physical Fault
With the schematic legend decoded, the parasitic draw localized to a specific fuse, and the network topology verified, the final step is physical isolation. Use the wiring diagram to identify intermediate connectors (e.g., C204, C310) that separate the power source from the load.
- Disconnect the intermediate connector closest to the load.
- Re-measure the voltage drop across the suspect fuse. If the drop disappears, the fault lies downstream (either a chafed wire harness rubbing against the chassis or a failed module).
- If the voltage drop remains with the module disconnected, inspect the wiring harness for physical damage. Pay special attention to areas where the harness passes through the firewall grommet or hinges (like the driver's door A-pillar boot), as repeated flexing causes the internal copper strands to break or short through the ISO 6722 specified insulation.
Summary: Maximizing Free Documentation
Free auto electrical wiring diagrams are powerful tools, but they are only as effective as the diagnostic flow you apply to them. By cross-referencing DIN/SAE standards, utilizing non-intrusive voltage drop testing across the PDC, and systematically isolating CAN/LIN bus wake-up faults, you can achieve dealer-level diagnostic accuracy without the dealer-level subscription fee. Always verify connector cavity matrices and ground node locations physically before condemning any expensive control module.